Stock market indices play a crucial role in the world of investing, providing a benchmark to measure the overall performance of a particular market or sector. For beginners, understanding these indices can seem overwhelming. In this beginner’s guide, we will explore two of the most widely recognized stock market indices, the Dow Jones Industrial Average (DJIA) and the S&P 500, as well as provide an overview of other major indices.
Starting with the , we will delve into its history, background, and significance in the stock market. Understanding how the DJIA is calculated is also essential to comprehend its representation of the market’s performance.
Moving on to the , we will provide an overview of this widely followed index, exploring its construction and its importance as a barometer of the broader U.S. stock market.
Furthermore, we will touch upon other major stock market indices, including the NASDAQ Composite Index, Russell 2000 Index, FTSE 100 Index, Nikkei 225 Index, and DAX Index, to understand their relevance and contributions to the global financial landscape.
Analyzing stock market indices is crucial for investors, and we will discuss how to interpret their performance, the impact of economic indicators on these indices, and the use of technical analysis in index trading.
Finally, we will explore different avenues for investing in stock market indices, such as ETFs and index funds, and highlight important risks and considerations that investors should be aware of.
By the end of this beginner’s guide, readers will have a solid foundation in understanding stock market indices and their significance in the world of investing, empowering them to make informed decisions when navigating the complex world of stocks.
What is the Dow Jones Industrial Average ?

Photo Credits: Www.Mfea.Com by Jeremy Thompson
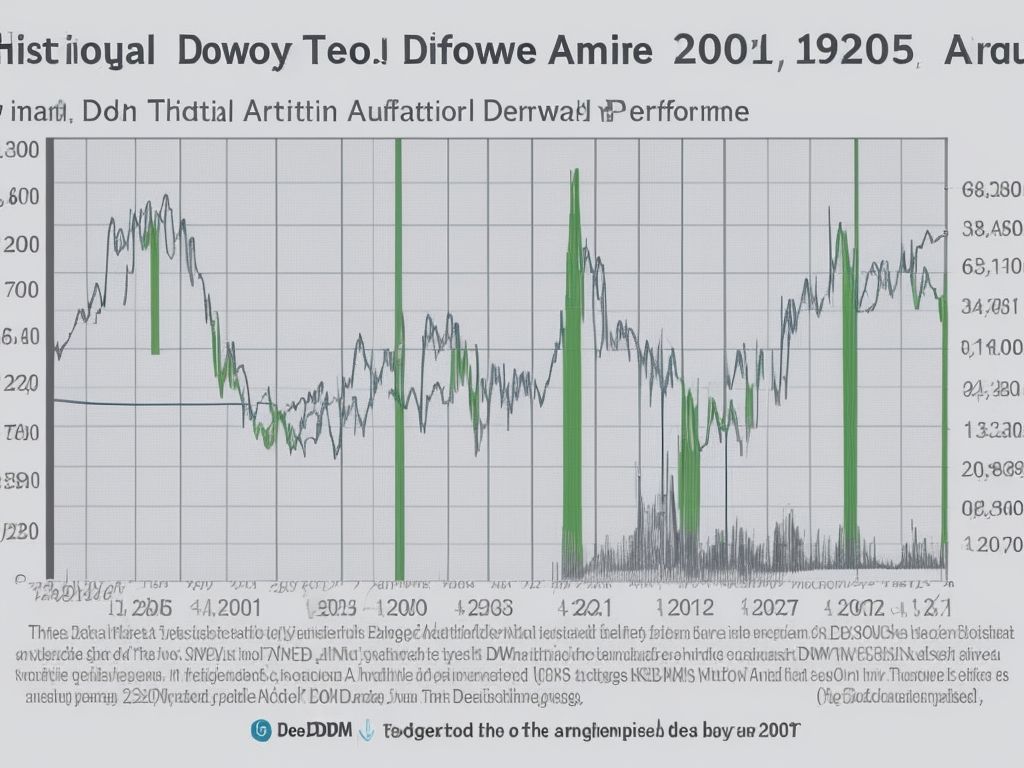
The Dow Jones Industrial Average (DJIA), also known as the Dow, is a stock market index that represents the performance of 30 large publicly traded companies in the United States. It is widely recognized as one of the most prominent stock market indices globally and serves as a barometer for assessing the overall health of the stock market. So, what is the Dow Jones Industrial Average? It is calculated by summing up the stock prices of these 30 companies and dividing the total by a predefined divisor to derive an average value. This average then acts as a benchmark for monitoring the daily performance of the stock market.
History and Background of DJIA
The Dow Jones Industrial Average (DJIA) has a fascinating history and background that traces all the way back to May 26, 1896. Charles Dow and Edward Jones were the brilliant minds behind its creation, initially comprising of 12 companies. As time went on, it grew to encompass 30 leading companies from diverse sectors, representing the economy in an inclusive manner. The main objective of the DJIA is to present a snapshot of the general well-being and performance of the stock market. Despite its methodology being based on stock prices, the DJIA remains widely observed and serves as a benchmark for both investors and analysts.
In the year 1929, an unforgettable crash occurred in the DJIA, famously known as Black Tuesday. This momentous day witnessed a staggering drop of almost 12%, leading to the devastating Great Depression. This event emphasizes the DJIA’s vital role in mirroring broader economic trends and its profound impact on investor sentiment.
How is DJIA Calculated?
The Dow Jones Industrial Average (DJIA) is calculated using a price-weighted method. How is DJIA Calculated? The index is comprised of 30 large publicly traded companies which are selected based on their reputation, industry leadership, and general interest to investors. To calculate the DJIA, the stock prices of these 30 companies are summed and divided by a divisor. The divisor is adjusted periodically to account for stock splits, dividends, and other factors that may affect the index. This ensures that changes in the index reflect changes in the overall stock prices of the component companies.
Here’s a simple table to illustrate the calculation:
| Company | Stock Price |
|---|---|
| Company A | $100 |
| Company B | $50 |
| Company C | $75 |
| Total | $225 |
| Divisor | 0.147480719 |
| DJIA | 1530.91 |
In 1928, Charles Dow, the creator of the Dow Jones Industrial Average, had to manually calculate the index using a pen, paper, and a basic calculator. Each night, he would gather the stock prices and spend hours doing the calculations. Today, the DJIA is calculated using sophisticated computer algorithms, enabling real-time updates and making it easier for investors to track market trends.
Importance of DJIA in the Stock Market
The Dow Jones Industrial Average (DJIA) holds great significance in the stock market. Its importance lies in its ability to provide a snapshot of the overall health and direction of the stock market, making it one of the oldest and most widely followed indices. Representing the performance of 30 major publicly traded companies, the DJIA is frequently referenced by investors and analysts as an indicator of market trends and sentiment. Its movements can have a significant impact on investor confidence and can influence the behavior of other market indices. In short, the DJIA plays a pivotal role in shaping investment decisions and market perceptions.
Fun fact: Did you know that the DJIA, which was first published in 1896 with 12 companies, has since grown to include 30 prestigious companies?
What is the S&P 500?

Photo Credits: Www.Mfea.Com by Randy Garcia
The S&P 500 is a stock market index that represents the performance of 500 large companies listed on US stock exchanges. It is widely considered a benchmark for the overall health of the US stock market. What is the S&P 500? The index is weighted by market capitalization, meaning that larger companies have a greater impact on its performance. Investors and analysts use the S&P 500 to track the performance of the stock market, make investment decisions, and compare the performance of individual stocks and portfolios against the index.
Overview of S&P 500
The S&P 500 is a widely recognized stock market index that provides an overview of the U.S. stock market. It measures the performance of 500 large-cap U.S. companies, serving as a benchmark for investors. The index’s performance is influenced by market capitalization, giving larger companies a greater impact. Constructed using a transparent rules-based methodology, the S&P 500 is regularly reviewed to ensure the inclusion of relevant companies. By analyzing the S&P 500’s performance, investors can gain insights into the overall health of the U.S. economy and make informed investment decisions.
True story: In 2020, during the COVID-19 pandemic, the S&P 500 experienced significant volatility. However, it demonstrated resilience and rebounded strongly, reaching new all-time highs in a relatively short period. This showcases the S&P 500’s capacity for recovery in challenging times and its ability to reflect the resilience of the U.S. stock market.
How is the S&P 500 Constructed?
The construction process of the S&P 500 index involves a market capitalization-weighted method. This method entails assigning weights to the companies based on their respective market values. Consequently, companies with larger market values have a more substantial impact on the index. To compile the index, a committee selects the 500 largest publicly traded companies in the United States. In choosing the constituents, the committee takes into account various factors including liquidity, sector representation, and financial viability. This meticulous approach ensures that the S&P 500 offers a comprehensive overview of the overall performance of the US stock market.
Significance of the S&P 500 in the Market
The significance of the S&P 500 in the market is immense due to its broad representation of the US economy and its influence on investor sentiment. As a benchmark index, the S&P 500 allows investors to gauge the overall market performance and assess the health of various sectors. Its importance is further attributed to its large market capitalization, widespread use in financial products, and inclusion of blue-chip companies. Both institutional and individual investors closely watch the performance of the S&P 500, making it a key indicator of market trends.
Understanding Other Major Stock Market Indices

Photo Credits: Www.Mfea.Com by Adam Williams
Discover the exciting world of stock market indices beyond the famous Dow Jones and S&P 500. In this section, we’ll dive into a handful of major stock market indices that play a significant role in global finance. From the technology-heavy NASDAQ Composite Index to the small-cap focused Russell 2000 Index, we’ll explore each index’s unique characteristics and their impact on the financial landscape. Hold on tight as we uncover the global powerhouse indices like the FTSE 100, Nikkei 225, and DAX Index, unveiling their key features and importance in the market.
NASDAQ Composite Index
The NASDAQ Composite Index is a stock market index that represents the performance of over 3,000 publicly traded companies listed on the NASDAQ stock exchange. It includes companies from various sectors, such as technology, biotechnology, telecommunications, and retail.
| Index Name: | NASDAQ Composite Index |
| Inception Date: | February 5, 1971 |
| Number of Companies: | 3,000+ |
| Market Capitalization: | Trillions of dollars |
| Weighting Methodology: | Market capitalization-weighted |
The NASDAQ Composite Index is widely followed by investors and traders as it provides a measure of the overall performance of the technology and growth sectors. It is considered a key benchmark for technology-focused investors and is used to track the performance of the broader stock market.
The NASDAQ Composite Index was established in 1971 with a base value of 100. Over the years, it has experienced significant growth, reflecting the rise of technology companies and the dot-com boom in the late 1990s. As technology continues to play a vital role in the global economy, the NASDAQ Composite Index remains an important indicator of the health and performance of the tech sector.
Russell 2000 Index
The Russell 2000 Index is a stock market index that tracks the performance of small-cap companies in the United States. Here is some key information about the index:
For a comprehensive understanding of stock market indices, you can refer to A Beginner’s Guide to Stock Market Indices: From Dow Jones to S&P 500. This guide will provide valuable insights into various stock market indices, including the well-known S&P 500 index.
| Index Name: | Russell 2000 Index |
| Components: | Approximately 2000 stocks |
| Market Coverage: | Small-cap companies |
| Weighting: | Each stock is equally weighted |
| Significance: | Representative of the broader small-cap segment of the U.S. stock market |
Pro-tip: When analyzing the Russell 2000 Index, consider that small-cap stocks can be more volatile than larger-cap stocks, and investors should diversify their portfolios to manage risk effectively.
FTSE 100 Index
The FTSE 100 Index is a stock market index that represents the 100 largest companies listed on the London Stock Exchange based on market capitalization. Here is a breakdown of the index:
| Component | Details |
| Size | 100 companies |
| Selection Criteria | Market capitalization |
| Sector Weighting | Companies are grouped into sectors such as Financials, Energy, and Consumer Goods |
| Performance | Tracks the performance of the UK stock market |
Investors often consider the FTSE 100 Index as a benchmark for the overall health of the UK economy. It is widely used by institutional and individual investors to monitor the performance of the UK stock market and make investment decisions. When investing, it is essential to consider the diverse sectors and individual companies comprising the index for a well-rounded portfolio.
Nikkei 225 Index
The Nikkei 225 Index is a major stock market index in Japan, representing the performance of 225 top companies listed on the Tokyo Stock Exchange. It was first introduced in 1950 and has since become one of the most widely followed stock indices in the world. The index is calculated based on the stock prices of its constituent companies and is weighted by market capitalization. The Nikkei 225 Index is important for investors and traders to assess the overall performance and trends of the Japanese stock market. Its value is widely used as a benchmark for various financial products and investment strategies.
Tip: Keep an eye on The Nikkei 225 Index for insights into the Japanese stock market’s direction and potential investment opportunities.
DAX Index
The DAX Index is the primary stock market index in Germany, representing the performance of the 30 largest and most actively traded German companies on the Frankfurt Stock Exchange. It is one of the most widely recognized and followed indices globally. The index is calculated using the prices of the constituent stocks and weighted by market capitalization. The DAX Index is an important benchmark for investors and serves as an indicator of the overall health and direction of the German economy. It is utilized by both domestic and international investors for portfolio analysis, risk management, and investment decision-making.
How to Analyze Stock Market Indices?

Photo Credits: Www.Mfea.Com by Dennis Anderson
Discovering how to analyze stock market indices is a key step for any investor. In this section, we unravel the mysteries behind the performance of these indices. From interpreting their performance to understanding the impact of economic indicators, and utilizing technical analysis for index trading, we will explore the various facets that go into analyzing stock market indices. So, buckle up and embark on a journey to unlock the secrets of the market’s pulse!
Interpreting the Performance of Indices
Analyzing the trends and movements of stock market indices, such as the Dow Jones Industrial Average (DJIA) and the S&P 500, is crucial for investors to make informed decisions. The interpretation of the performance of these indices is essential to assess the overall health and direction of the market. Factors like market breadth, volume, and price trends are utilized to understand the performance of the indices. It is important to note that while indices provide valuable insights, individual stocks within the index may exhibit different performances. Therefore, investors should consider this aspect when making investment decisions based on index performance.
Impact of Economic Indicators on Indices
| Economic Indicators | Impact on Indices |
| Gross Domestic Product (GDP) | A strong GDP growth is usually associated with positive stock market performance, showcasing the impact of economic indicators on indices. |
| Unemployment Rate | A high unemployment rate can lead to a decrease in consumer spending, impacting stock market indices negatively and highlighting the impact of economic indicators on indices. |
| Inflation Rate | High inflation can erode purchasing power, potentially resulting in decreased profitability and lower stock prices, indicating the impact of economic indicators on indices. |
| Interest Rates | Lower interest rates can stimulate economic growth and boost market confidence, positively affecting stock market indices, thus demonstrating the impact of economic indicators on indices. |
| Consumer Confidence Index | A higher level of consumer confidence indicates optimism, leading to increased consumer spending and potentially driving up stock prices, emphasizing the impact of economic indicators on indices. |
Using Technical Analysis for Index Trading
- Using technical analysis for index trading can provide valuable insights and help inform investment decisions. Here are some steps to incorporate in your approach:
- Identify key indicators: Use technical indicators such as moving averages, relative strength index (RSI), and Bollinger Bands to identify trends and potential entry or exit points.
- Analyze chart patterns: Look for patterns like head and shoulders, double tops or bottoms, and flag formations to predict future price movements.
- Monitor volume: Volume can confirm the strength of a trend. Higher volume during an uptrend indicates bullish sentiment, while lower volume during a downtrend suggests bearish sentiment.
- Set stop-loss and take-profit levels: Determine your risk tolerance and set stop-loss levels to protect against potential losses. Set take-profit levels to ensure you capture profits when the price reaches a certain target.
- Stay updated on news and events: News and economic data releases can significantly impact the performance of stock market indices. Stay informed to anticipate potential market moves and adjust your trading strategy accordingly.
By incorporating technical analysis for index trading, you can enhance your decision-making process and potentially increase your chances of success.
Investing in Stock Market Indices

Photo Credits: Www.Mfea.Com by Stephen Thompson
Interested in investing in stock market indices? This section explores the exciting world of investing in stock market indices, covering two key sub-sections: ETFs and Index Funds, and Risks and Considerations. Discover how ETFs and Index Funds can help diversify your portfolio and potentially generate consistent returns. We’ll also delve into the risks and considerations you should be aware of when it comes to navigating the world of stock market indices. Get ready to supercharge your investment strategy!
ETFs and Index Funds
ETFs and index funds are highly popular investment options for individuals seeking exposure to stock market indices. These investment vehicles offer investors a convenient and cost-effective means of investing in a diversified portfolio of stocks that closely reflect the performance of the underlying index. ETFs, also known as exchange-traded funds, can be easily bought and sold on stock exchanges, providing flexibility and liquidity. On the other hand, index funds are mutual funds that aim to replicate the performance of a specific index. Both ETFs and index funds present investors with an opportunity to participate in the overall market growth while minimizing risk through diversification.
Over the years, the popularity of ETFs and index funds has skyrocketed. The first ETF, called the SPDR S&P 500, was introduced in 1993, enabling investors to gain exposure to the S&P 500 index. This groundbreaking innovation transformed the investment landscape by offering a low-cost and easily tradable alternative to traditional mutual funds. Since then, the number of ETFs and index funds has grown exponentially, covering a wide range of indices and asset classes. This allows investors to tailor their investment strategies according to their specific objectives and risk tolerance levels.
Risks and Considerations
When it comes to investing in stock market indices, understanding the risks and considerations associated with it is crucial. Risks and considerations include market volatility, economic fluctuations, and company-specific risks. It is essential to diversify your portfolio to mitigate potential losses. Staying informed about market trends and conducting thorough research is vital for making informed investment decisions. Seeking guidance from a financial advisor can also provide valuable insights and help manage risks. Remember, investing in stock market indices can offer significant opportunities, but it is important to carefully assess the risks and considerations involved before diving in.
Frequently Asked Questions
What are stock market indexes?
Stock market indexes are numerical indicators that represent the performance of a specific section or the entire stock market. They provide a snapshot of the overall strength of the economy and serve as a financial barometer for investors.
What are the main indices followed in the United States?
The most followed stock market indexes in the United States are the S&P 500, Dow Jones Industrial Average, and Nasdaq Composite. These flagship indices represent different segments of the U.S. equity market and are widely used as benchmarks for performance reporting and portfolio allocations.
How are stock market indexes constructed?
Stock market indexes can be constructed using different methodologies. They can be market-weighted, meaning the weight of each stock in the index is based on its market capitalization, or price-weighted, where stocks with higher prices have a larger impact on the index’s performance.
What is the purpose of index funds?
Index funds are investment vehicles that track market indexes, such as stocks or bonds. They are designed to replicate the performance of the chosen index by investing in all the components included in that index. This allows investors to passively invest in a diverse range of securities and minimize the need for active fund management.
How can index funds be purchased?
Shares of index funds can be bought through a brokerage account or directly with the mutual fund company. When choosing an index fund, it is important to consider factors such as how closely it tracks the index, its costs, any limitations or restrictions, and whether the fund provider offers other index funds of interest.
What are the benefits of investing in index funds?
Investing in index funds provides several benefits, including easy and effective wealth building, as they match the performance of the financial markets over time. They also offer diversification, reducing the risk of significant losses, and minimize the need for investment research by relying on the index’s performance.
